Solutions Using the SE and EMU Echelle Spectrographs
LIBS (Laser Induced Breakdown Spectroscopy)
LIPS (Laser Induced Plasma Spectroscopy)
Laser Induced Breakdown Spectroscopy (abbreviated as LIBS) is sometimes called Laser Induced Plasma Spectroscopy (abbreviated as LIPS). LIBS is an analysis technique in atomic spectroscopy for identifying the elements of a sample in any physical state, whether it is a solid, liquid or gas. A high power, pulsed laser is focused on the sample to excite the ions and create a plasma, vaporizing a small amount of the sample. Once the plasma cools and the electrons recombine with the atoms, the electrons emit radiation at their characteristic frequencies, enabling element identification. In principle, LIBS can detect any element because all elements emit light of characteristic frequencies when excited to sufficiently high temperatures. The only limitations are the power of the laser, as well as the sensitivity and wavelength range of the spectrograph and detector.
During LIBS, the laser is focused onto an area of a sample to ablate a small amount of material, which excites and atomizes the sample to form a plasma. At the high temperatures during the early plasma, the ablated material dissociates (breaks down) into excited ionic and atomic species. During this time, the plasma emits a continuum of radiation (called Bremsstrahlung) in which relatively few atomic emission lines can be identified. But within a very small timeframe, the plasma expands quickly, and then it cools. At this point the characteristic atomic emission frequencies of the elements can be observed. The delay between the emission of continuum radiation and atomic emission is on the order of 1 µs, depending on the sample. A gated detector is sometimes required so just the spectral data of the atomic emission lines can be captured.
The following diagram illustrates a typical LIBS setup. The beam from an ND:YAG pulsed laser is focused on a sample using a focusing lens. Collection optics, focused on the sample, transmit the atomized radiation emitted by the sample through a fiber optic to the echelle spectrograph. The spectrograph disperses the atomized radiation into spectral emission wavelengths that are imaged onto the attached camera. A delay generator between the laser and the camera controls the start of data acquisition so the camera captures an image of the plasma when the atomic emission wavelengths are most prominent. When the camera completes the exposure, the spectral data is sent to the computer for processing, display and analysis.
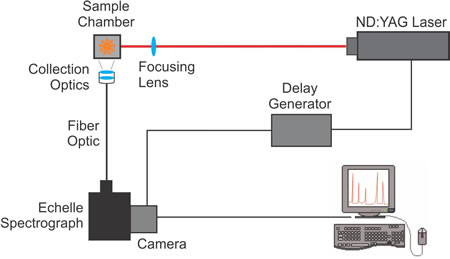
- The laser is fired (< 10 nanosecond pulse) at the sample, and at the same time, the laser sends a signal to the delay generator.
- The sample is excited, the ablated material breaks down and forms a plasma, which emits continuum radiation.
- As the plasma cools and the electrons recombine with the atoms, they emit atomic radiation. The delay generator sends a signal to the camera to start the exposure.
- The camera acquires an image of the atomic emission radiation, which is transmitted to the spectrograph through a fiber optic cable connected to the collection optics.
- When the exposure is complete, the spectral data is sent from the camera to the computer, where it is processed into calibrated wavelength units.
The SE and EMU echelle spectrographs are ideal for LIBS because of their broad wavelength coverage in each exposure, and their high resolving power. The EMU series of echelles has the added advantage of very high throughput, F/3 or better.
The SE series of echelle spectrographs has been used for LIBS applications since 2001. The EMU-120/65 was designed specifically for LIBS experiments on a future Mars rover mission, and it has been used for LIBS since it was first commercialized in 2009.
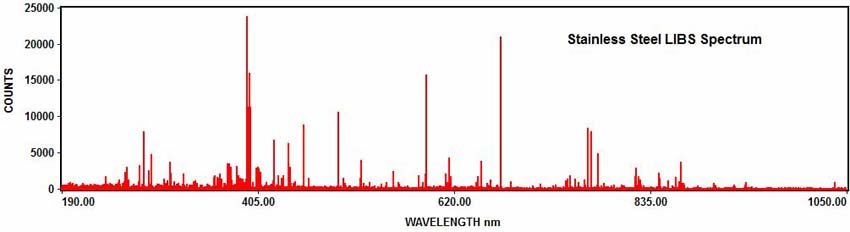
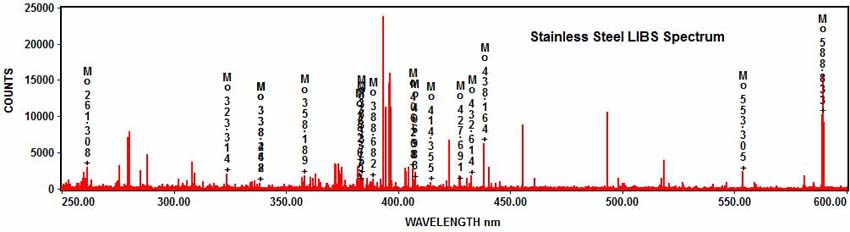
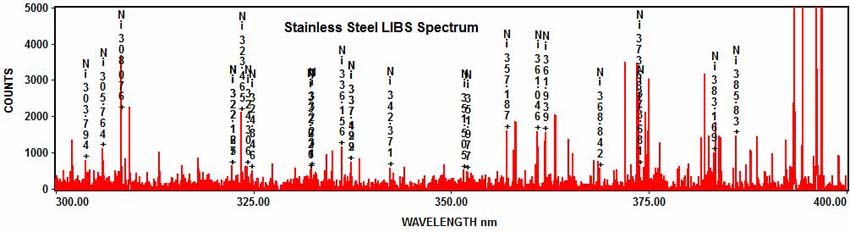
The following example shows how LIBS is used for elemental analysis. The LIBS spectrum shown below was acquired with the EMU-120/65 echelle spectrograph, an EMCCD camera, and a ND:YAG nanosecond laser. The sample was a piece of stainless steel. The acquired LIBS spectrum covered the entire UV/VIS/NIR wavelength range from 190nm to 1050nm in one exposure:
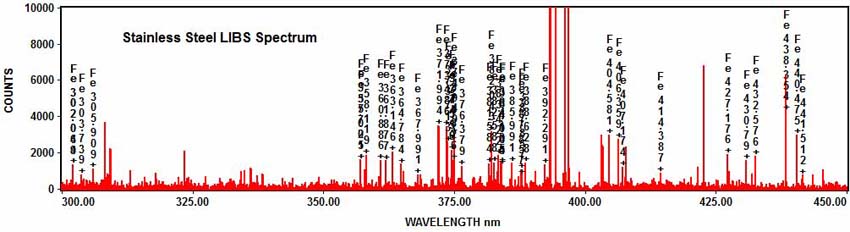
The elements in the spectrum can be determined with element identification software. For example, numerous iron emission peaks can be identified in the stainless steel spectrum:
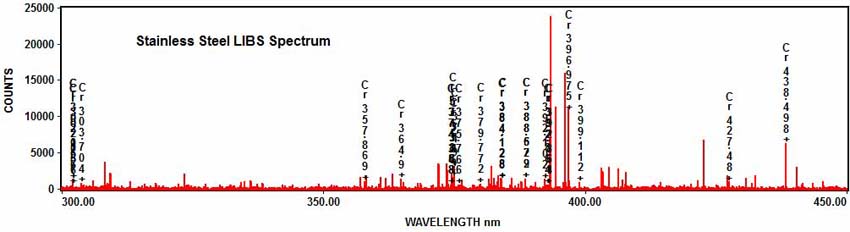
Stainless steel also contains chromium:
As well as molybdenum:
And nickel:
Citations:
The SE 200 and EMU-65 spectrographs are explained in the "Echelle Spectrograph" section of the Handbook of Laser-Induced Breakdown Spectroscopy, Second Edition by David A. Cremers & Leon J. Radziemski (London: John Wiley & Sons, 2013):
http://www.wiley.com/WileyCDA/WileyTitle/productCd-1118567366.html
Other articles that describe the use of LIBS with the SE 200 echelle spectrograph at LANL (Los Alamos National Laboratory):
- Lunar and planetary science in 2004 at LANL: http://www.lpi.usra.edu/meetings/lpsc2004/pdf/1912.pdf
- Mars polar exploration in 2004 at LANL: http://www.opticsinfobase.org/as/abstract.cfm?uri=as-58-8-897
- Study of Venus mission in 2004 at LANL: http://www.sciencedirect.com/science/article/pii/S0584854704001211
CBRNE (Chemical, Biological, Radiological, Nuclear, Explosives) Detection
Combining LIBS with chemometric analysis can provide identification of chemical substances, such as explosives, pathogens and chemical agents.
The following article describes the use of the SE 200 echelle spectrograph to identify chemical substances:
The following article explains the discrimination of chemical and biological agents with LIBS and the SE 200 spectrograph in 2004 at ARL (Army Research Laboratory):
http://www.sciencedirect.com/science/article/pii/S0584854705001497
The EMU-120/65 echelle spectrograph aided in the detection of the explosive RDX in 2011 at ARL:
http://www.opticsinfobase.org/ao/abstract.cfm?URI=ao-51-7-B13
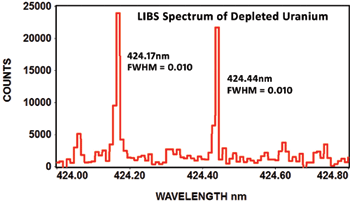
The following spectrum of depleted uranium shows the EMU-120/65 can clearly resolve the isotope shift at 424nm with a resolving power of ~42,400 (wavelength/FWHM). This depleted uranium spectrum is courtesy of Applied Research Associates in Albuquerque, New Mexico:
The following article describes how the EMU-120/65 echelle spectrograph was used to monitor uranium isotopes in 2011 at ORNL (Oak Ridge National Laboratory):
http://www.opticsinfobase.org/as/abstract.cfm?uri=as-66-3-250
Photoluminescence Analysis
Photoluminescence (abbreviated as PL) is a process in which a substance such as a crystalline material is excited to a higher energy state by the absorption of photons, and then it returns to a lower energy state by the emission of photons. The source of the excitation is typically a continuous laser beam. PL is frequently used for measuring the defects in the crystaline structure of semiconductors, including Si, GaAs and others.
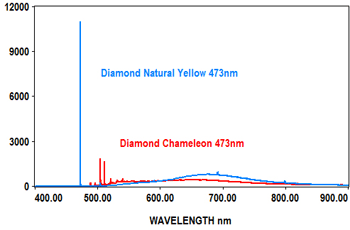
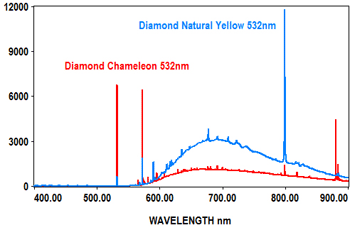
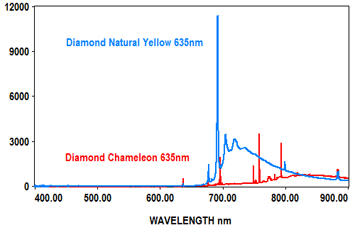
PL analysis can also be used to measure the characteristics of gemstones at various laser wavelengths, which typically include 405nm, 473nm, 532nm and 635nm. The EMU-120/65 VIS/NIR echelle spectrograph is ideal for covering the full range of the PL spectra for these wavelengths at high resolution with high throughput (F/2).
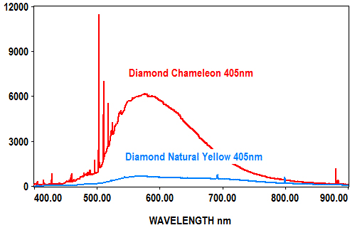
The following spectra show how the EMU-120/65 VIS/NIR spectrograph was used at four laser wavelengths to differentiate between a rare "chameleon" diamond and a natural yellow diamond. Each spectral curve covers the broadband wavelength range of 400nm to 900nm. The chameleon diamond, the red spectrum, is clearly differentiated from the natural yellow diamond, the blue spectrum, at each of the four laser wavelengths.
All diamond spectra are courtesy of Gemlab (Liechtenstein).
Forensic Science and Environmental Studies
The LIBS technique has been used to measure the carbon content of soils as part of research in climate change. Our SE 200 echelle spectrograph was used in the first test instruments in 2002 at LANL (Los Alamos National Laboratory):
http://www.photonics.com/Article.aspx?AID=12640
The following article explains the use of LIBS and the SE 200 spectrograph to determine the carbon and nitrogen content of soils in 2003 at ORNL (Oak Ridge National Laboratory):
http://www.opticsinfobase.org/ao/abstract.cfm?uri=AO-42-12-2072
Combining LIBS with multivariate statistical analysis can provide identification of elements and inorganic components in organic samples.
The next article describes the use of LIBS and the SE 200 spectrograph to identify inorganic components and predict elemental content in 2005 at ORNL:
http://www.sciencedirect.com/science/article/pii/S0584854705001540
The following article explains the use of LIBS and the SE 200 spectrograph to analyze human cremation remains, prosthetic implants and the carbon content of soils in 2007 at ORNL:
http://www.sciencedirect.com/science/article/pii/S0584854707003576
Raman Spectroscopy
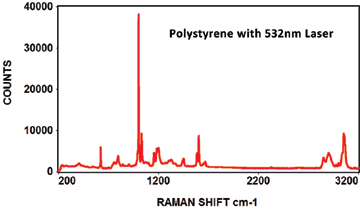
Like photoluminescence, the EMU-120/65 VIS/NIR instrument is ideal for Raman because of its high resolution and fast F/2 throughput. The broad spectral range of the instrument (350nm to 1100nm) can accommodate multiple laser wavelengths. The typical VIS lasers used for Raman are 457nm, 473nm, 488nm, 514nm, 532nm, 633nm and 660nm wavelengths. The typical NIR lasers used for Raman are 785nm, 830nm and 980nm wavelengths. That's ten different laser wavelengths that can be used with the EMU-120/65 VIS/NIR instrument.
If UV lasers between 244nm and 364nm are required, the EMU-120/65 UV/VIS/NIR instrument is an option for Raman spectroscopy. The UV/VIS/NIR version of the instrument covers ~190nm to 1100nm at high resolution with about F/3 throughput.
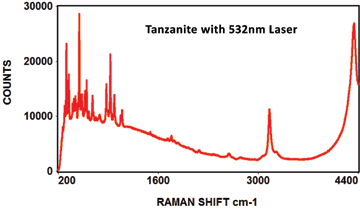
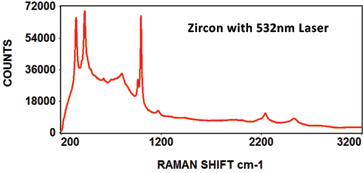
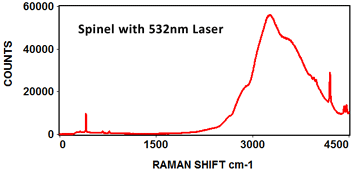
The following Raman spectra were acquired by Catalina Scientific using the EMU-120/65 VIS/NIR spectrograph and a 532nm laser:
OES, AES (Optical/Atomic Emission Spectroscopy)
Optical/Atomic emission spectroscopy (abbreviated OES or AES) is a method of chemical analysis that uses the intensity of light emitted from a flame, plasma, arc or spark at a particular wavelength to determine the quantity of an element in a sample. The wavelength of the atomic spectral lines gives the identity of the element, while the intensity of the emitted light is proportional to the concentration of atoms.
Inductively Coupled Plasma-Optical Emission Spectroscopy (ICP-OES) is used in both industry and research labs to identify chemical elements and their concentrations. Identification of contaminants in drinking water is a key application for ICP-OES. Most elements can be detected at better than 1 ppm (parts per million) in water samples, and many elements can be detected at 1 ppb (parts per billion). ICP-OES is used to analyze the process water in the semiconductor industry, the discharge from wastewater treatment plants, the ore samples and waste in the mining industry, and the oil and drilling waste in the petroleum industry. Research labs use ICP-OES in the fields of chemistry, environmental science, geology and ecology.
ICP-OES converts elements in a liquid form into a gaseous, excited state using a high energy argon plasma. The sample, called analyte, is introduced into a nebulizing chamber and converted into a fine mist by a high pressure stream of argon gas. The finest drops of the analyte are drawn into a Fassel Torch, where the stream of argon gas creates a plasma. The plasma is energized within the torch by a radio frequency coil that delivers ~1500 Watts of power to the argon plasma containing the droplets of analyte. Once the analyte droplets are in the plasma, they evaporate and their constituent molecules are broken down into atoms, which are then excited into high energy states. The atoms emit light at characteristic wavelengths as they decay from their high energy state. These characteristic wavelengths, and the photon flux at each wavelength, measure the concentration of each element in the sample.
The optical spectrum is collected by a spectrometer. An echelle spectrograph is ideal for ICP-OES because of the broad wavelength coverage in each spectral image, and the high resolving power of an echelle. Both the SE 200 and EMU-120/65 echelle spectrographs cover the full UV-VIS-NIR wavelength range in each image captured by the camera. The SE 200 is capable of a resolving power (wavelength/FWHM) of about 5,000 and the EMU-120/65 is capable of a resolving power from about 5,000 up to more than 50,000.
The following diagram illustrates a typical ICP-OES setup.
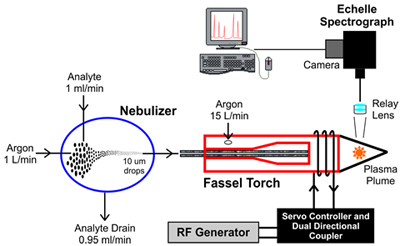
- Nebulizer: The test sample in liquid form, called the analyte, is converted into a fine spray in the nebulizing chamber. A stream of high pressure argon gas breaks down the analyte into various droplet sizes within the chamber. The largest drops, about 95% of the analyte, are directed out the drain. Droplets of ~10 microns or smaller, about 5% of the analyte, are directed into the Fassel Torch.
- Fassel Torch: The torch generates an inductively coupled plasma by heating a stream of argon gas to a temperature in excess of 5000K. The argon gas is ionized and a plasma is generated. The torch is heated by the electromagnetic field created by the high frequency current in the coil towards the tip of the torch tube.
- Echelle Spectrograph: A relay lens, focused on the plasma plume, transmits the atomized radiation emitted by the plasma to the echelle spectrograph. The spectrograph disperses the atomized radiation into spectral emission wavelengths that are imaged onto the attached camera. The spectral data captured by the camera is sent to the computer, where the results are processed, analyzed and displayed.
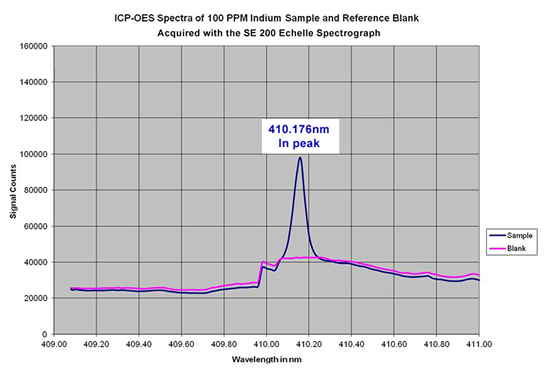
The SE 200 echelle spectrograph has been tested for use in an ICP-OES system. As an example, spectral data was acquired for a reference sample and a sample that contained 100 ppm of Indium. The SE 200 easily detected the In peak at 410.176nm when compared to the reference sample, as shown in the overlay of the two spectra below:
| For more information, please contact us: |
Catalina Scientific 2555 North Coyote Drive, Suite 113 Tucson, AZ 85745 USA Phone: 520-571-8000 |
Entire site copyright © 1998-2026, Catalina Scientific |